Trade Show ROI: How to Measure It and Build a Post-Event Report
“How many leads did we get?” is the wrong first question after a trade show. The useful questions are how good those leads were, what they cost, and what they turned into. This guide gives you the formulas, the timeline and a post-event report structure that answers all three.
Claire Bennett6 min read
The quick answer
Trade show ROI compares what an event earned with what it cost:
ROI = (revenue attributed to the event − total event cost) ÷ total event cost
Because B2B sales take months, you also need early indicators: cost per qualified lead, unique companies reached, seniority reached and opportunities created. A good post-event report shows these within a week of the show, and adds revenue as deals close.
Step 1: Count the full cost
Most ROI calculations look better than reality because costs are missed. Include:
| Cost | Examples |
|---|---|
| Space | Booth or table fee |
| Booth | Design, build, furniture, graphics, electricity, internet |
| People | Travel, accommodation, meals, and staff time away from other work |
| Logistics | Shipping, storage, handling |
| Materials | Brochures, samples, giveaways, printed cards |
| Lead tools | Lead retrieval rental, scanning apps |
| Marketing | Pre-show emails, ads, sponsorships |
Step 2: Use the right formulas
| Metric | Formula | What it tells you |
|---|---|---|
| Cost per lead | Total cost ÷ total leads | The price of each contact |
| Cost per qualified lead | Total cost ÷ qualified leads | The price of each contact worth following up |
| Qualification rate | Qualified leads ÷ total leads | How good your booth conversations were |
| Opportunity value | Sum of value of opportunities created from event leads | Potential revenue in play |
| ROI | (Revenue attributed − total cost) ÷ total cost | Whether the event paid for itself |
Define “qualified” before the show, for example “interested in a quote, with a timeline under six months”. That is what intent signals are for.
Step 3: Measure in stages
| When | What to report |
|---|---|
| Day 1 to 7 | Contacts, unique companies, qualified leads, seniority reached, follow-ups sent |
| Day 30 | Meetings booked, responses, cost per qualified lead |
| Day 90 | Opportunities created and their value |
| Month 6 to 12 | Revenue closed, ROI |
Reporting only at month 12 means nobody remembers the event. Reporting only at day 1 means you count scans, not results.
Ready for your next event?
Bring every booth conversation back with context.
Capture cards and badges in seconds, qualify leads on the spot and give your team a clean next step.
Step 4: Report on quality, not just quantity
“We scanned 400 badges” says little. Two booths with 400 scans can have very different results. Report:
- Unique companies, not just contacts. Ten people from one company is one account.
- Seniority reached. How many decision makers did you speak with?
- Top companies. Which accounts are worth the most attention?
- Qualified leads, based on your intent signals.
- Team performance. Who captured what, so you can coach and staff the next show.
- Follow-up status. How many qualified leads were contacted within a day or two?
How the Habsy Platform builds the post-event report
On the Habsy Platform, you create a campaign for each event, and the team’s scans are grouped under it. Campaign analytics then show:
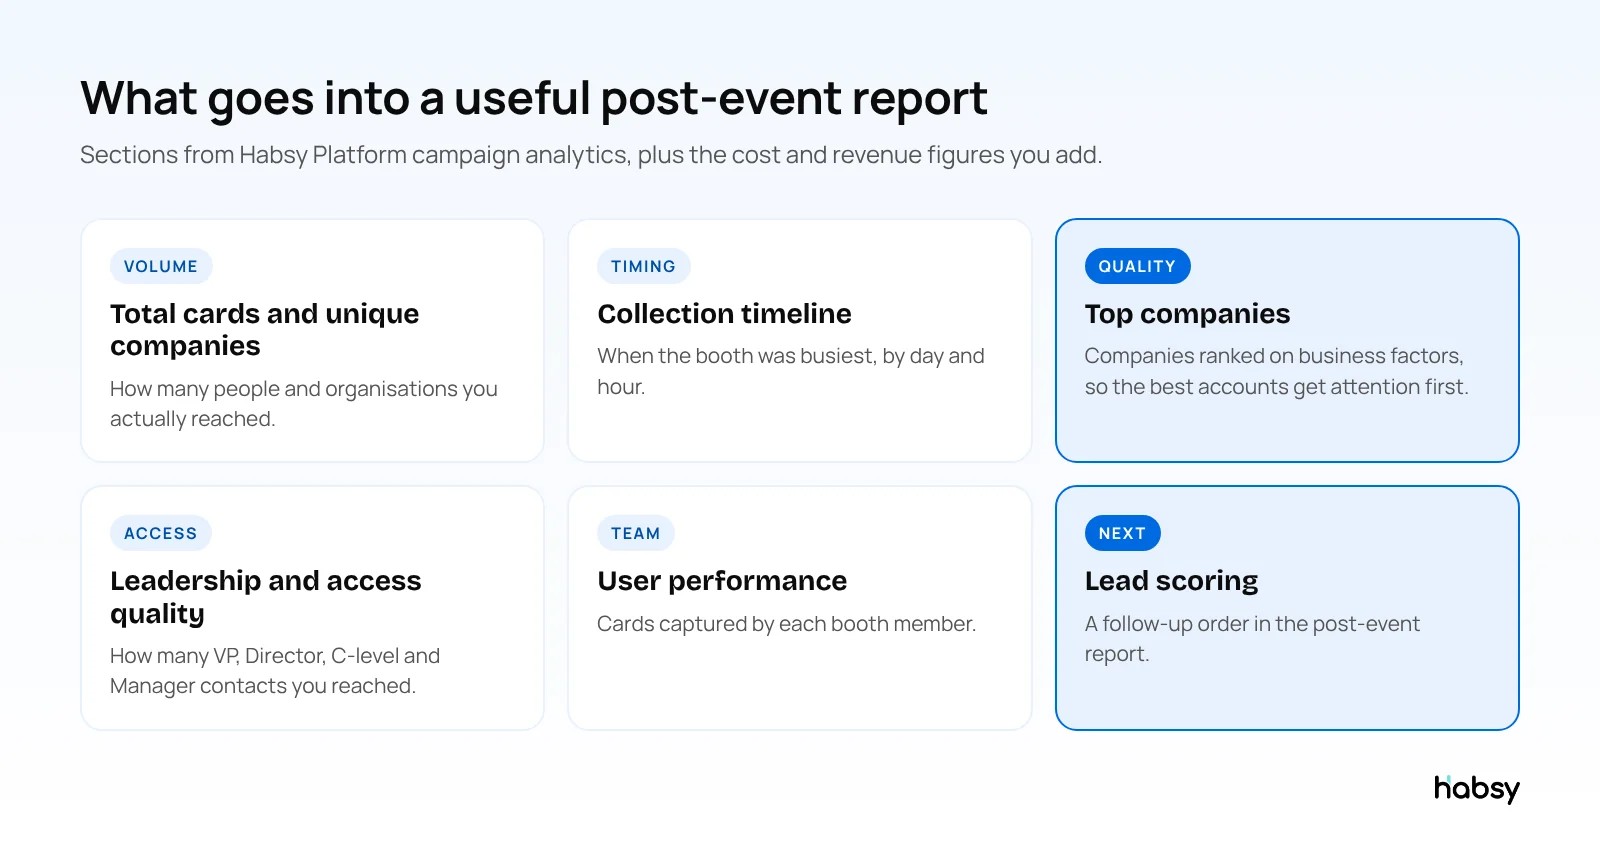
- Total cards and unique companies with enriched data, so you see accounts reached, not just scans
- Collection timeline across the days of the event
- Top companies, ranked on business factors such as industry and company size, to help prioritise high-value opportunities
- Leadership and access quality: how many VP, Director, C-level and Manager contacts you reached, and which companies you reached through several people
- User performance: a leaderboard of cards captured by each booth member
- Lead scoring in the post-event report, to help decide the follow-up order
From the same campaign, you can reach leads by email, WhatsApp and LinkedIn with AI-written messages, assign contacts to team members with reminders, push selected leads to your CRM, and export with filters.
Add your cost figures and, later, opportunity and revenue figures from your CRM, and you have a complete ROI report.
A worked example (illustrative)
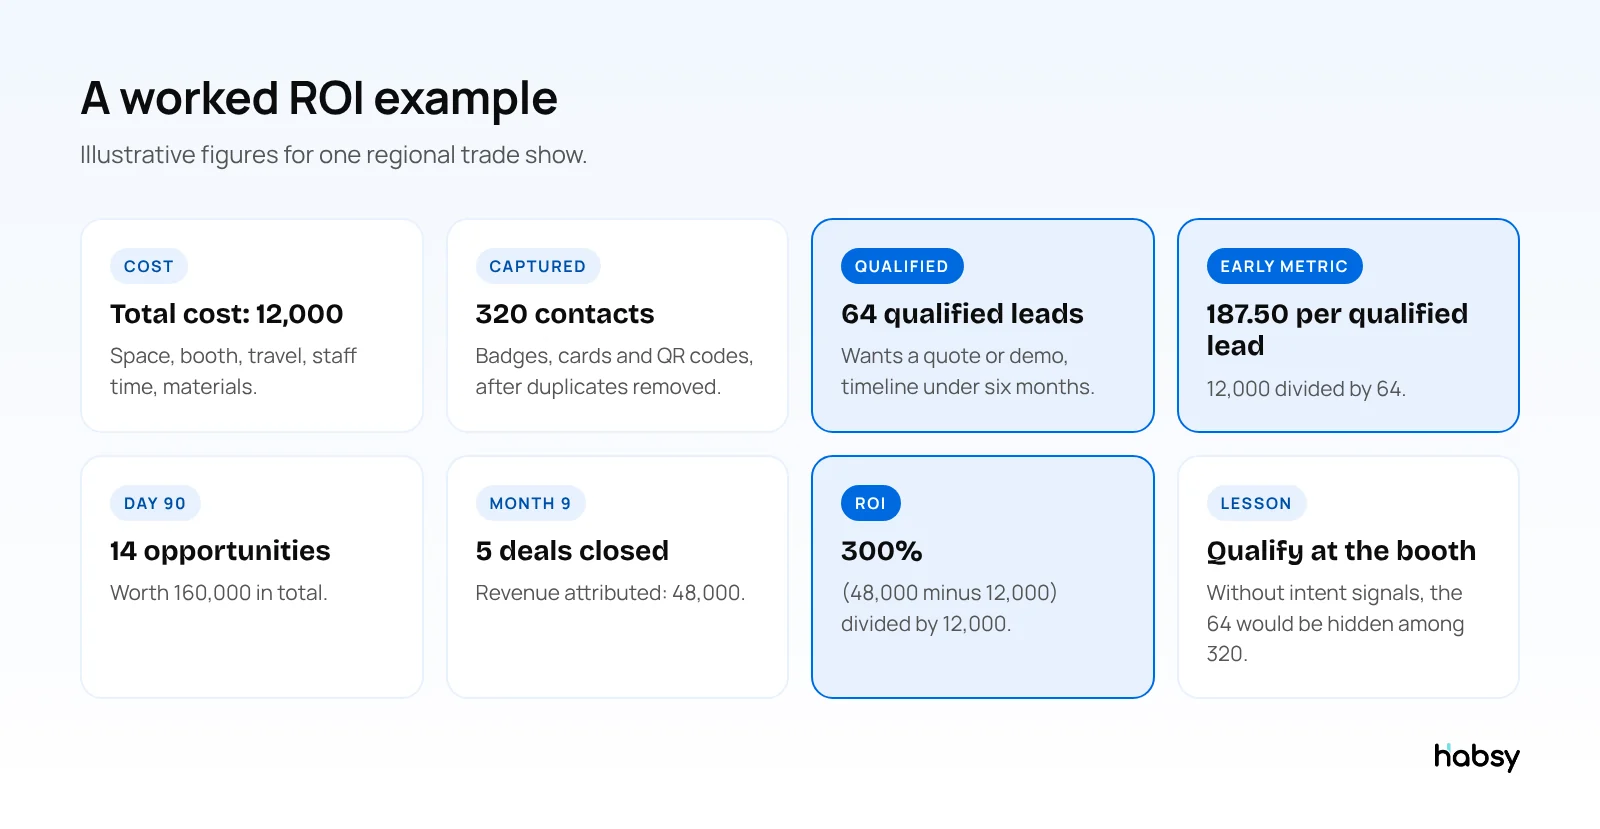
The numbers below are made up for illustration, in a single currency, but the method is the one to use.
| Step | Figure | How it is calculated |
|---|---|---|
| Total cost | 12,000 | Space 4,500, booth 3,000, travel and staff 3,500, materials 1,000 |
| Contacts captured | 320 | After duplicates were resolved |
| Qualified leads | 64 | Intent signals: wants a quote or demo, timeline under six months |
| Cost per lead | 37.50 | 12,000 ÷ 320 |
| Cost per qualified lead | 187.50 | 12,000 ÷ 64 |
| Qualification rate | 20% | 64 ÷ 320 |
| Opportunities at day 90 | 14, worth 160,000 | From the CRM, traced by the event tag |
| Revenue at month 9 | 48,000 | 5 deals closed |
| ROI | 300% | (48,000 − 12,000) ÷ 12,000 |
Two things made this report possible. The team recorded intent signals at the booth, so the 64 qualified leads could be separated from the 320 on Day 1. And every contact carried the event tag into the CRM, so the revenue at month 9 could be traced back to the show.
What makes the numbers trustworthy
ROI is only as good as the data behind it:
- Capture every contact, not just badges. Visitors who hand over cards or show QR codes count too. See lead capture vs lead retrieval.
- Qualify at the booth, not the next day.
- Remove duplicates before counting. Habsy flags possible duplicates for you to review.
- Tag every contact with the event, so CRM revenue can be traced back.
- Follow up fast. Leads that wait go cold. See why follow-up timing determines networking ROI.
Bottom line
Trade show ROI is revenue minus cost, divided by cost, but you only get a trustworthy number if you count every cost, capture every contact with context, and report on quality from the first week. The Habsy Platform turns each event into a campaign with the post-event report built in. See the Habsy Platform.
Frequently Asked Questions
How do you calculate trade show ROI?
Trade show ROI = (revenue attributed to the event − total event cost) ÷ total event cost. Because B2B deals take months, also track early indicators such as cost per qualified lead and the value of opportunities created.
What costs should be included in trade show ROI?
Booth space, booth design and build, travel and accommodation, staff time, shipping and storage, printed and promotional materials, lead retrieval rental, sponsorships and any pre-show marketing.
What should a post-event report include?
Total contacts and unique companies, how many were qualified, which companies and seniority levels you reached, team performance, cost per lead and per qualified lead, follow-up status and, later, opportunities and revenue.
When should I measure trade show ROI?
Report on lead quality within a week, on opportunities created at about 90 days, and on revenue at 6 to 12 months, depending on your sales cycle.
How does Habsy help measure trade show ROI?
On the Habsy Platform, each event is a campaign. Campaign analytics show total cards, unique companies with enriched data, a collection timeline, top companies, user performance and leadership access, and the post-event report includes lead scoring to help decide the follow-up order.
Ready for your next event?
Bring every booth conversation back with context.
Capture cards and badges in seconds, qualify leads on the spot and give your team a clean next step.